Don’t tell me I did not warn you. The only thing I can promise is that you’ll learn a thing or two from this one, so please read on.
I came across a predictive validity framework called the “Libby boxes”, popularized by Cornell Accounting Professor Robert Libby. This framework is used to examine the distinction between underlying constructs of strategic objectives and their proxy measures to illustrate causal models related to some objectives in an organization. Another definition of “strategy” is as a hypothesis about the cause and effect of your objectives. Predictive validity allows you to measure and analyze how well the execution of your objective (cause) predicts your desired performance (effect).
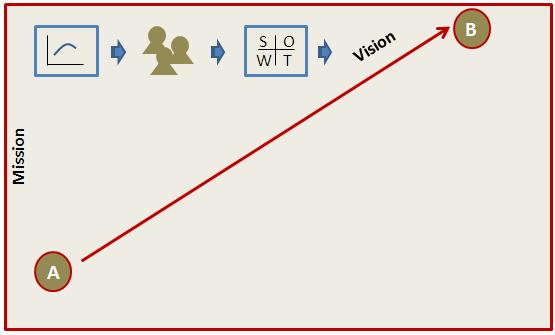
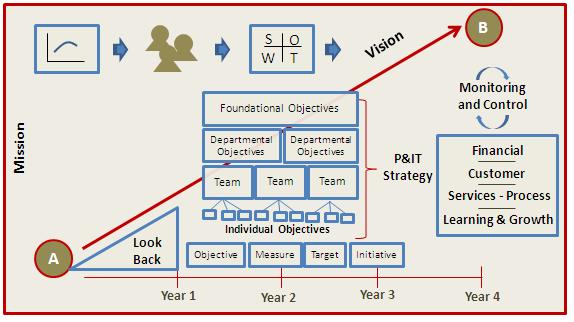
Simple Business-IT Strategy
Now, to illustrate the importance of a Business Relationship Management (BRM) function in an Information Technology (IT) organization, let’s start by picking a Business-IT strategy to dissect. Let’s call it “Strategy A”.
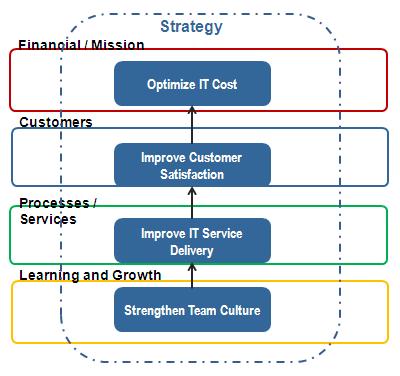
Strategy A: “Create business value through better use of technology.”
Let’s start it simple and take an approach to illustrate cause and effect depict Strategy A using the model. We are going to be taking a very logical approach. The strategy here is— you believe that if you use technology better, you create business value. Let’s assume that technology is comprised of infrastructure and applications that enable the business or enterprise.
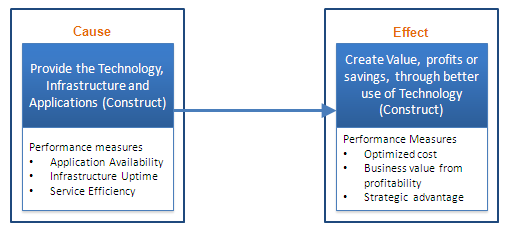
Observe that Strategy A is too simple—or maybe exceedingly simple. Can we really say that if IT provides better technology, we create business value, in the form of profits or savings? Yes, no, maybe. How about this – it is because of better use of technology, we improve business processes of the company and therefore we create business value. In this predictive validity framework, the middle action is called, mediating variable. It stands between two variables and it is an effect of one variable and the cause to another. This brings us to iteration to our business-IT strategy. Let’s refer to this improved business-IT strategy as “Strategy B”.
Strategy B: “Create value by improving business processes through better use of technology”.

So how do you interpret this strategy? As an IT organization, your goal is to provide the business with the technology, infrastructure and applications to enable efficient business processes. This will result to business value creation through optimized cost, profitability and strategic advantage. Whew! Follow all that so far?
I think this business-IT strategy works. If you run this, you have a good chance of successful outcomes. But your aim is not to be just good. Your aim is to be great. Your goal is to differentiate your IT department and to support your enterprise to be the best performing company in its industry or to be the best performing company (period!).
The Missing Component to be great
So there is a missing component to your strategy, a moderating component—a component that will have a multiplying effect from certain causes and effects coming out from the collective work that you do. In this predictive validity framework, it is called the moderating variable. The moderating variable is a variable that determines how big an effect you get from a certain cause.
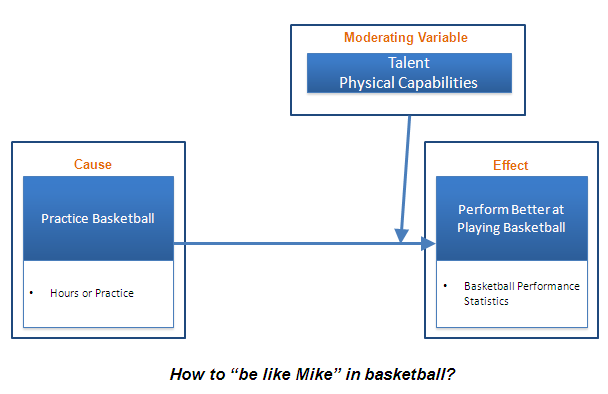
To illustrate, let’s say you want to improve your performance at playing basketball. By practicing basketball, doing drills and shooting, for sure it will improve your performance. This is a very simple causal model. You practice more and that, in effect, will improve your basketball performance. But think about this, is there a certain amount of practice that will allow you to be like Mike (Michael Jordan)? Most likely, no. Talent and perhaps physical capacities are the moderating variables here. Sure, practice will improve your performance, but if you have a lot of talent, a little bit of practice goes a long way and will make you much better. If you don’t have that much talent, you’ll have to practice a lot to get just a little better. Talent in this case is a moderating variable.
Now that you understand what a moderating variable is, let’s go back to our Business-IT strategy. Think about an organizational capability equivalent to talent that can potentially transition your IT organization from good to great—it is business relationship management (BRM).

BRM in this case is a moderating variable. The BRM capabilities moderate the effect of improvement of business processes and enablement of new business capabilities on performance, making it bigger (due to converged business-IT strategy) or smaller (in cases where it is lacking). Improved business processes and enablement of new business capabilities doesn’t cause BRM capabilities, it just moderates the effect. How? BRMs (1) facilitate Business-Provider convergence, (2) ensure that use of Technology that drives maximize value and (3) facilitate productive and connections and mobilize business-IT projects and programs.

For many years, IT organizations responsible for deploying technology systems to enable business capabilities have had one goal in mind – namely, to assure business-IT alignment. Today, however, as IT capabilities become more and more embedded in business capabilities, and given the pace of technological change and the pervasive nature of IT, alignment is no longer sufficient. The goal today, therefore, is “convergence”. This has given momentum to the growing emergence of the Business Relationship Management (BRM) role, which, according to the Business Relationship Management Institute (BRMI), is about “stimulating, surfacing and shaping business demand for a provider’s products and services, ensuring that the potential business value from those products and services is captured, optimized and communicated.”